Assess the performance of window and facade systems
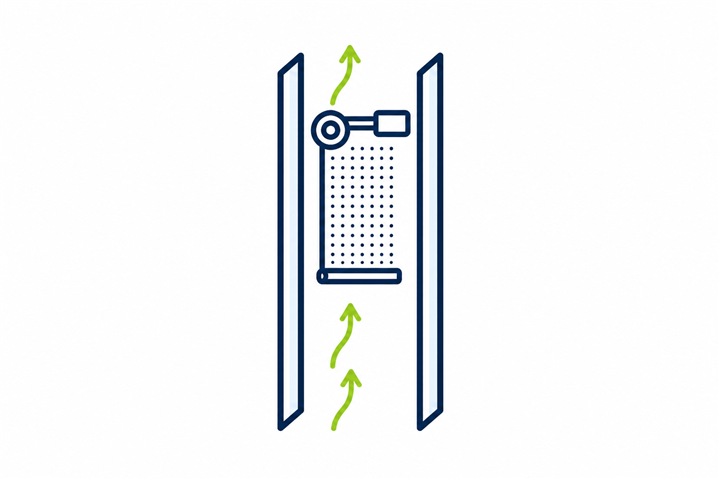
Ventilation is only as effective as the actual airflow path
Box-type double windows and multi-skin glass facades react to wind pressure, indoor and outdoor temperatures and the geometry of their openings. Depending on the operating state, airflow may flush the cavity effectively or cause heat build-up, reverse flow and short-circuiting between inlet and outlet.
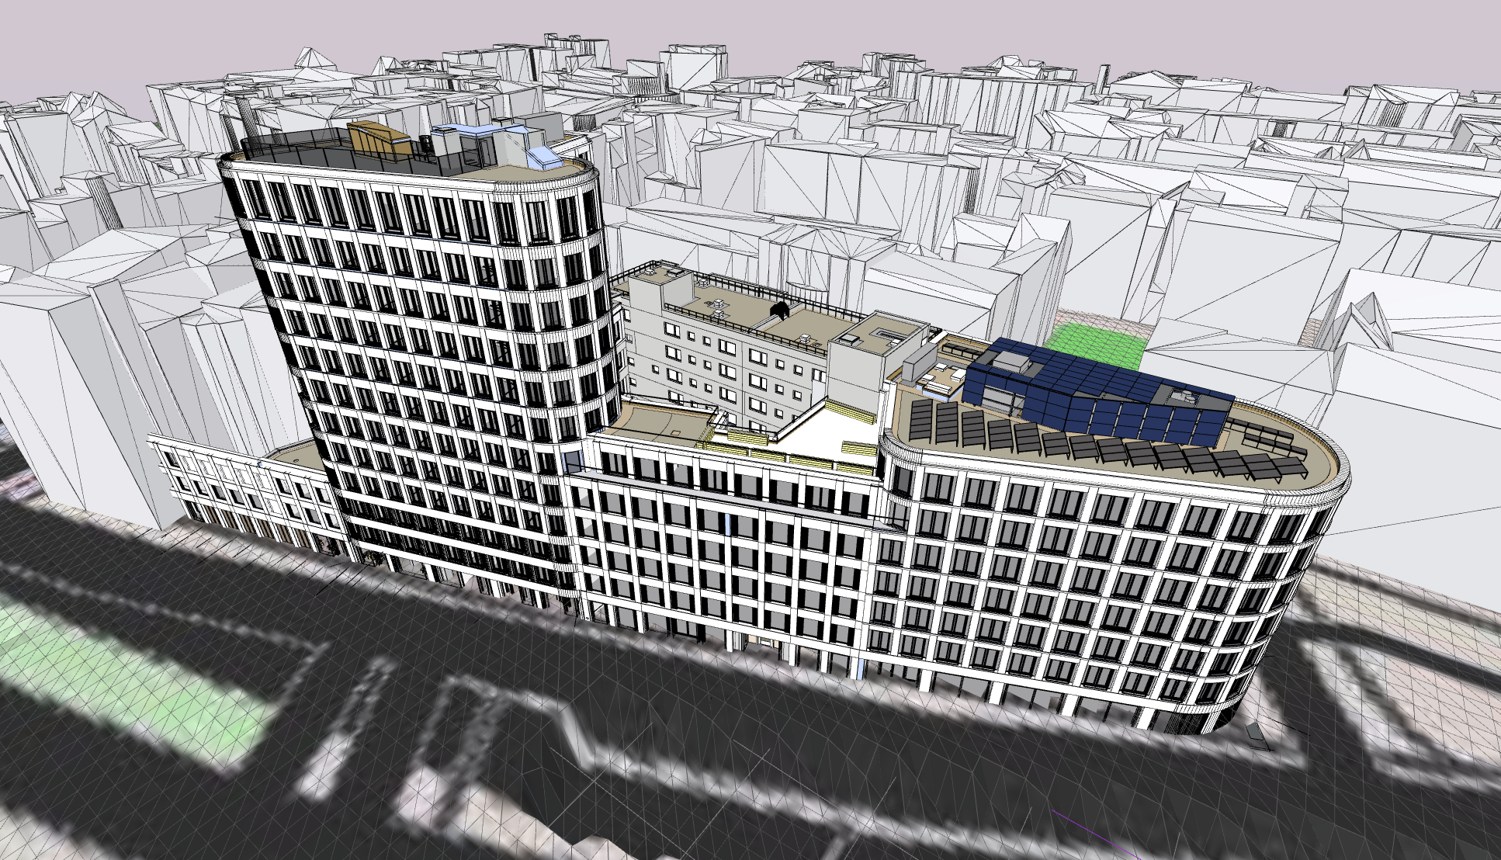
Consider the building, facade and surroundings together
The overall model represents the building form, facade zones, rooftop structures and surrounding development. It provides the pressure and temperature conditions acting on each box window and facade opening before the detailed model resolves the local airflow path.
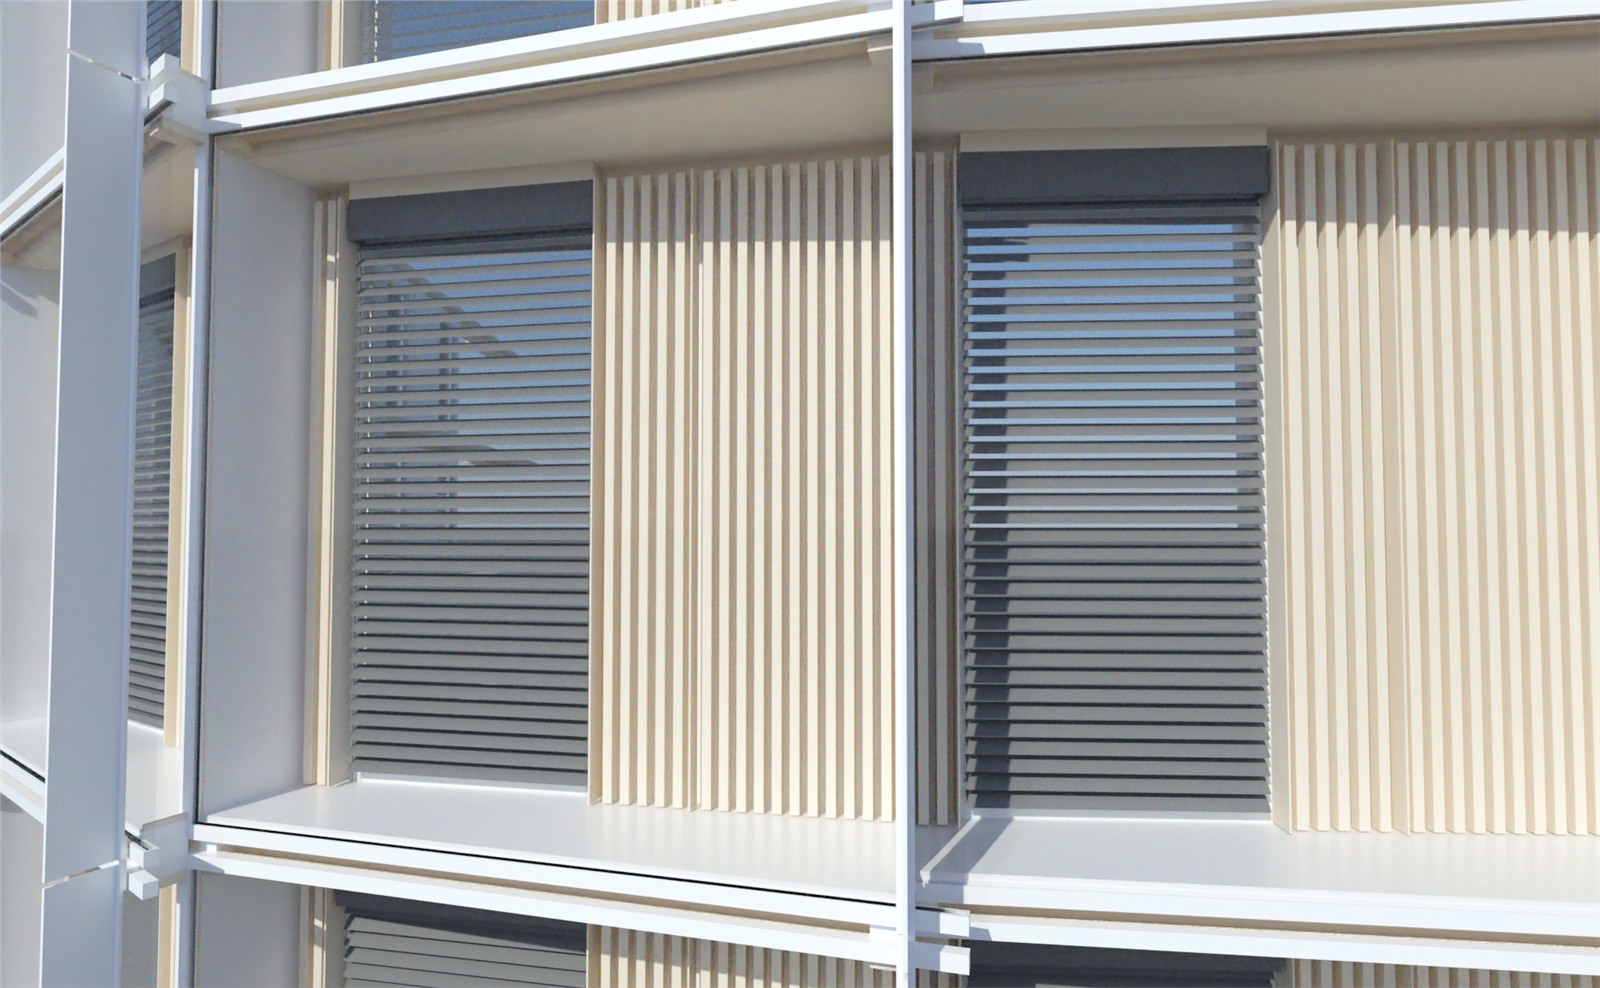
Lateral ventilation through perforated panels
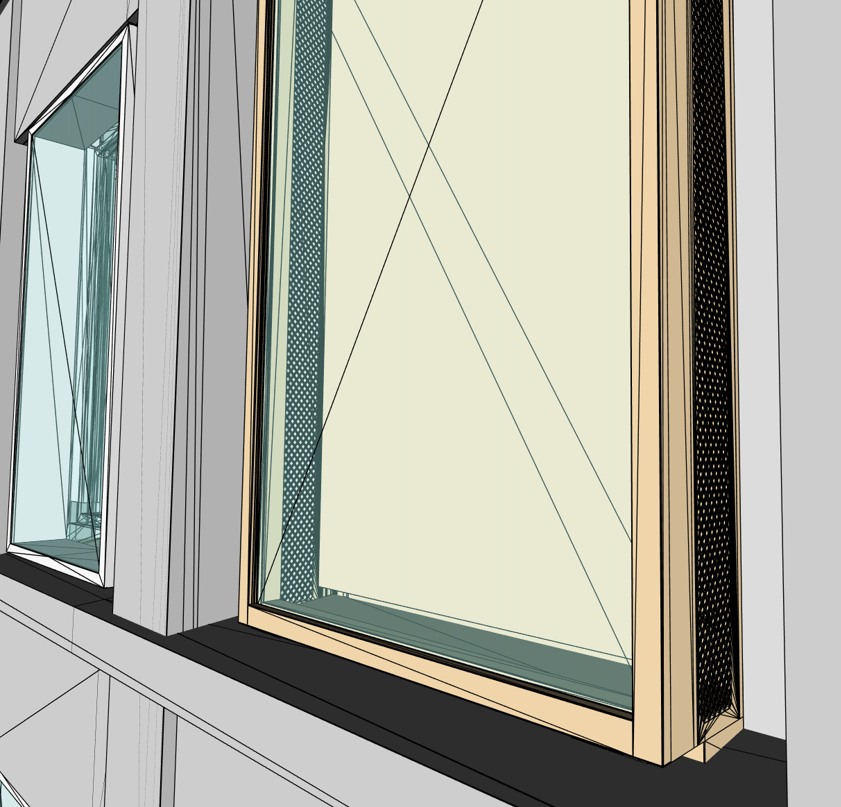
Air enters and leaves the window cavity through lateral perforated panels. The free opening area, arrangement, cavity depth and local pressure difference determine the actual volume flow. The CFD model resolves the panel geometry or represents it with a calibrated pressure loss.
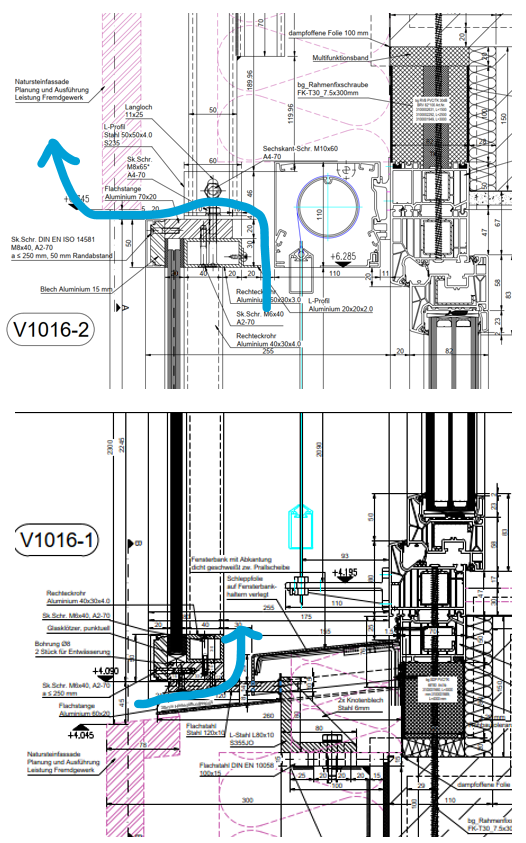
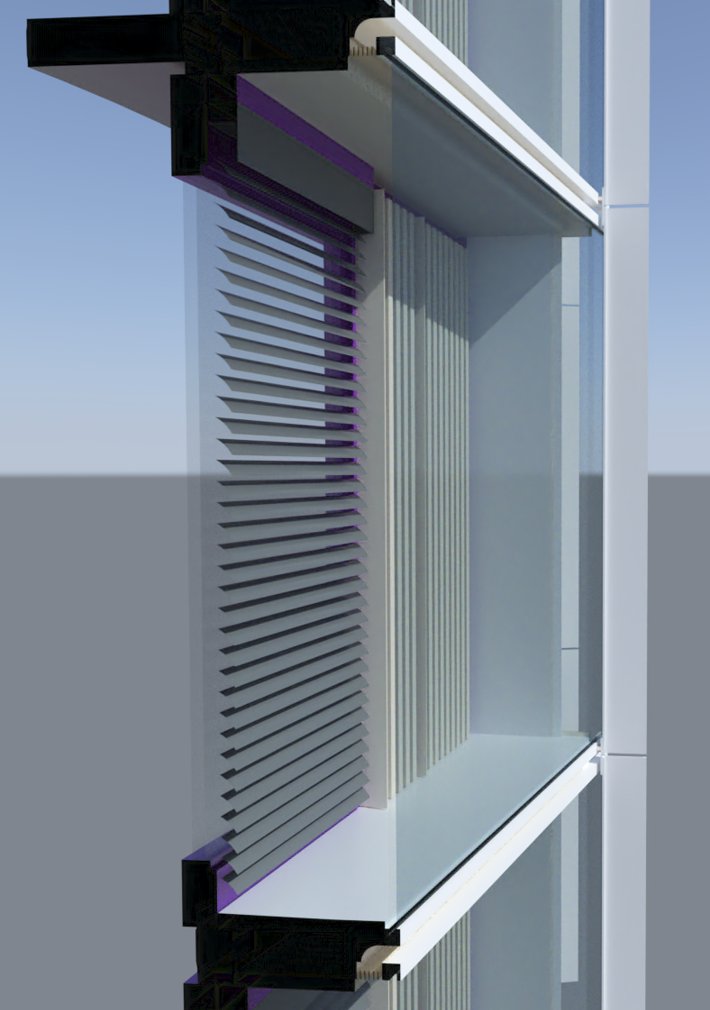
From construction detail to an airflow-effective CFD model
The technical section and three-dimensional model show which components control the airflow path. Reveals, weather grilles, tight turns, solar shading and connection details create additional pressure losses and are resolved wherever they affect flow rate, temperature or direction.
From a detailed facade model to thermal assessment
The facade is represented with all flow- and heat-relevant openings, cross-sections, layers and components. Defined summer and winter cases combine U-values, glazing g-values, solar gains, wind and indoor and outdoor temperatures.
- 01
Build the facade geometry including relevant openings, components and operating positions
- 02
Assign U-values, g-values, material properties, wind pressure and indoor and outdoor temperatures
- 03
Simulate representative summer and winter cases including solar radiation and window positions
- 04
Evaluate air exchange, volume flow and mean and local maximum cavity temperatures
- 05
Derive design improvements, HVAC load inputs and thermal suitability of motors and drives
Verify the thermal suitability of cavity components
Summer temperatures in the facade cavity can substantially exceed outdoor and room temperatures. Mean values and local peaks at the screen, tubular motor and drive components are compared with their permissible operating temperatures.
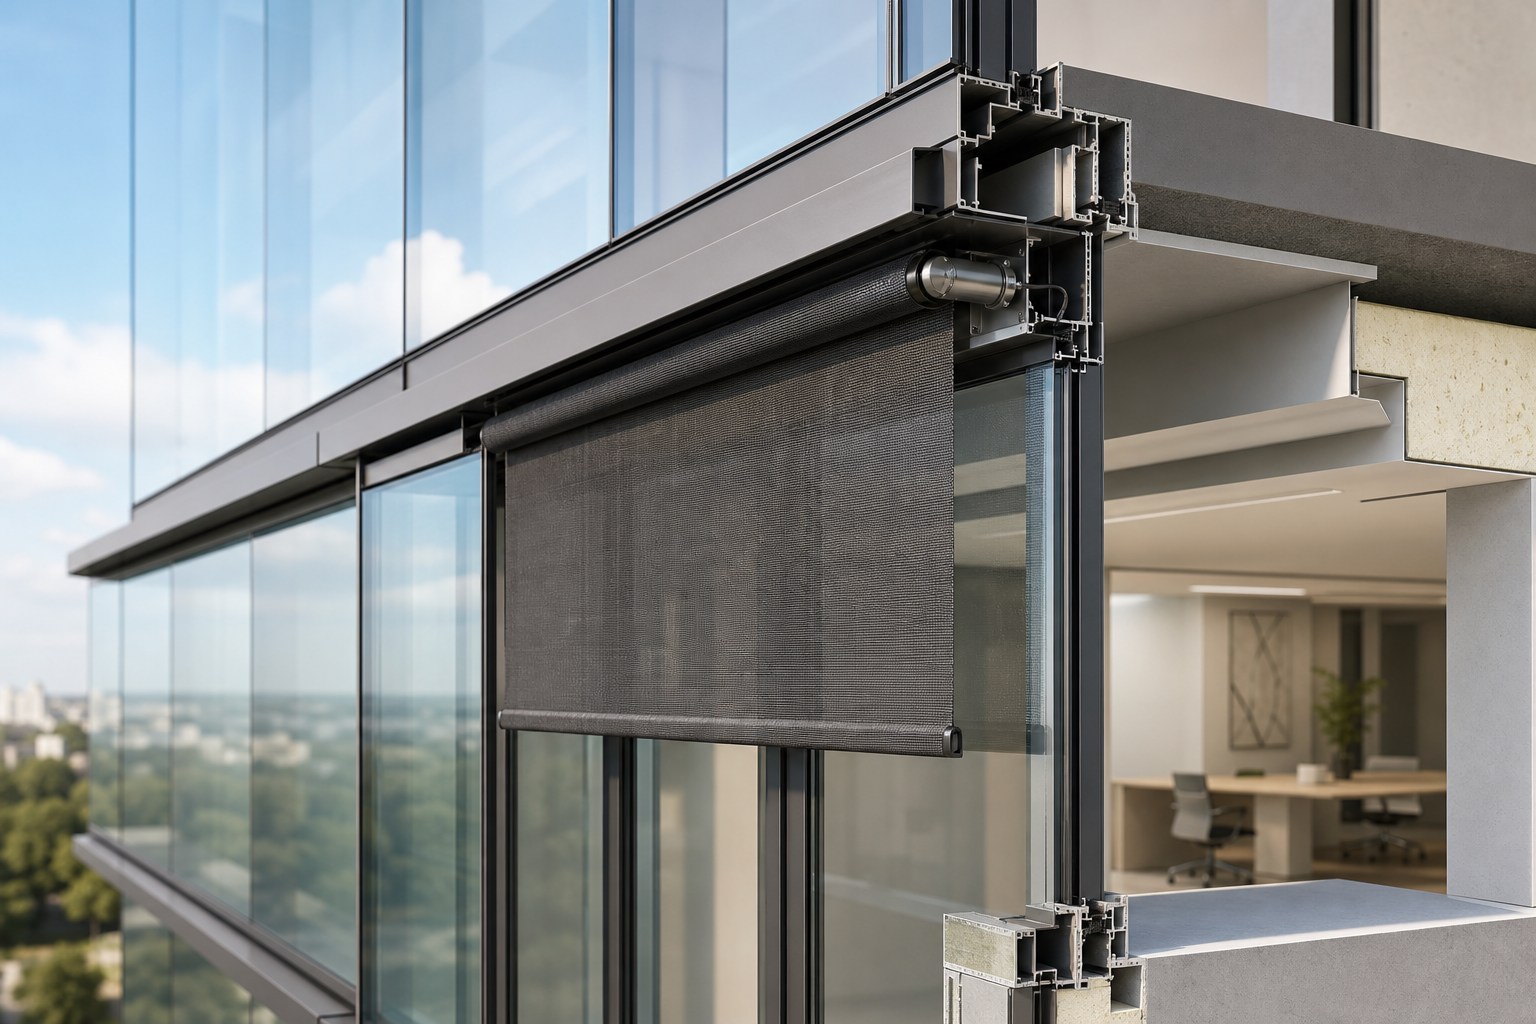
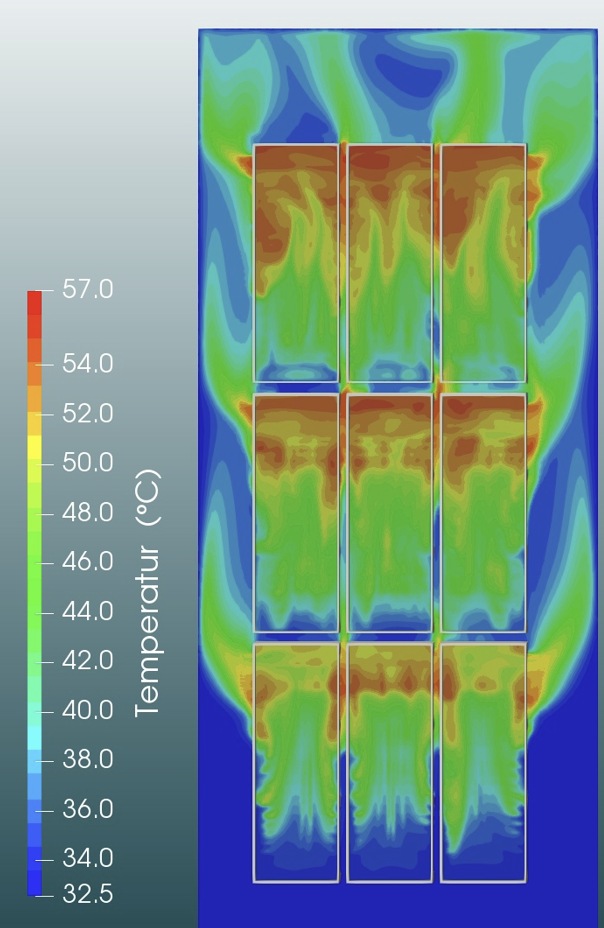
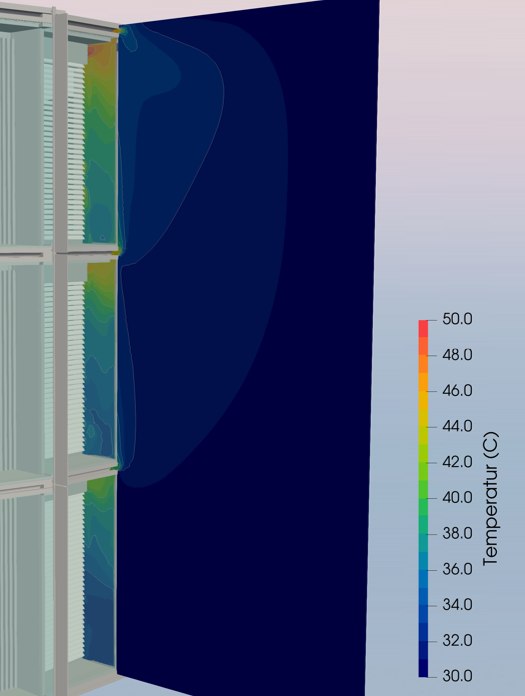
Temperature distribution instead of one average value
The results show both the distribution across facade fields and the temperature development through the window cavity and adjacent zone. Hot spots become visible alongside cooler, better ventilated areas, allowing the ventilation strategy to be improved element by element.
Evidence for the next planning decisions
Frequently asked questions
When is a facade-cavity simulation useful?
When wind pressure, buoyancy, solar gains and different opening positions interact and simplified assumptions cannot reliably quantify ventilation.
Can individual connection details be included?
Yes. Restrictions, turns, grilles and other resistances can be resolved geometrically or represented by calibrated characteristics.
Can different window positions be compared?
Yes. Open, closed and staged operating states as well as different inlet and outlet areas can be compared.
Can motor and solar-shading temperatures be checked?
Yes. Local temperatures are evaluated at the intended installation positions and compared with the permissible component limits.
Define the planning question together
We clarify which scenarios, assessment quantities and deliverables are appropriate for your project.