Spatial CO₂ distribution
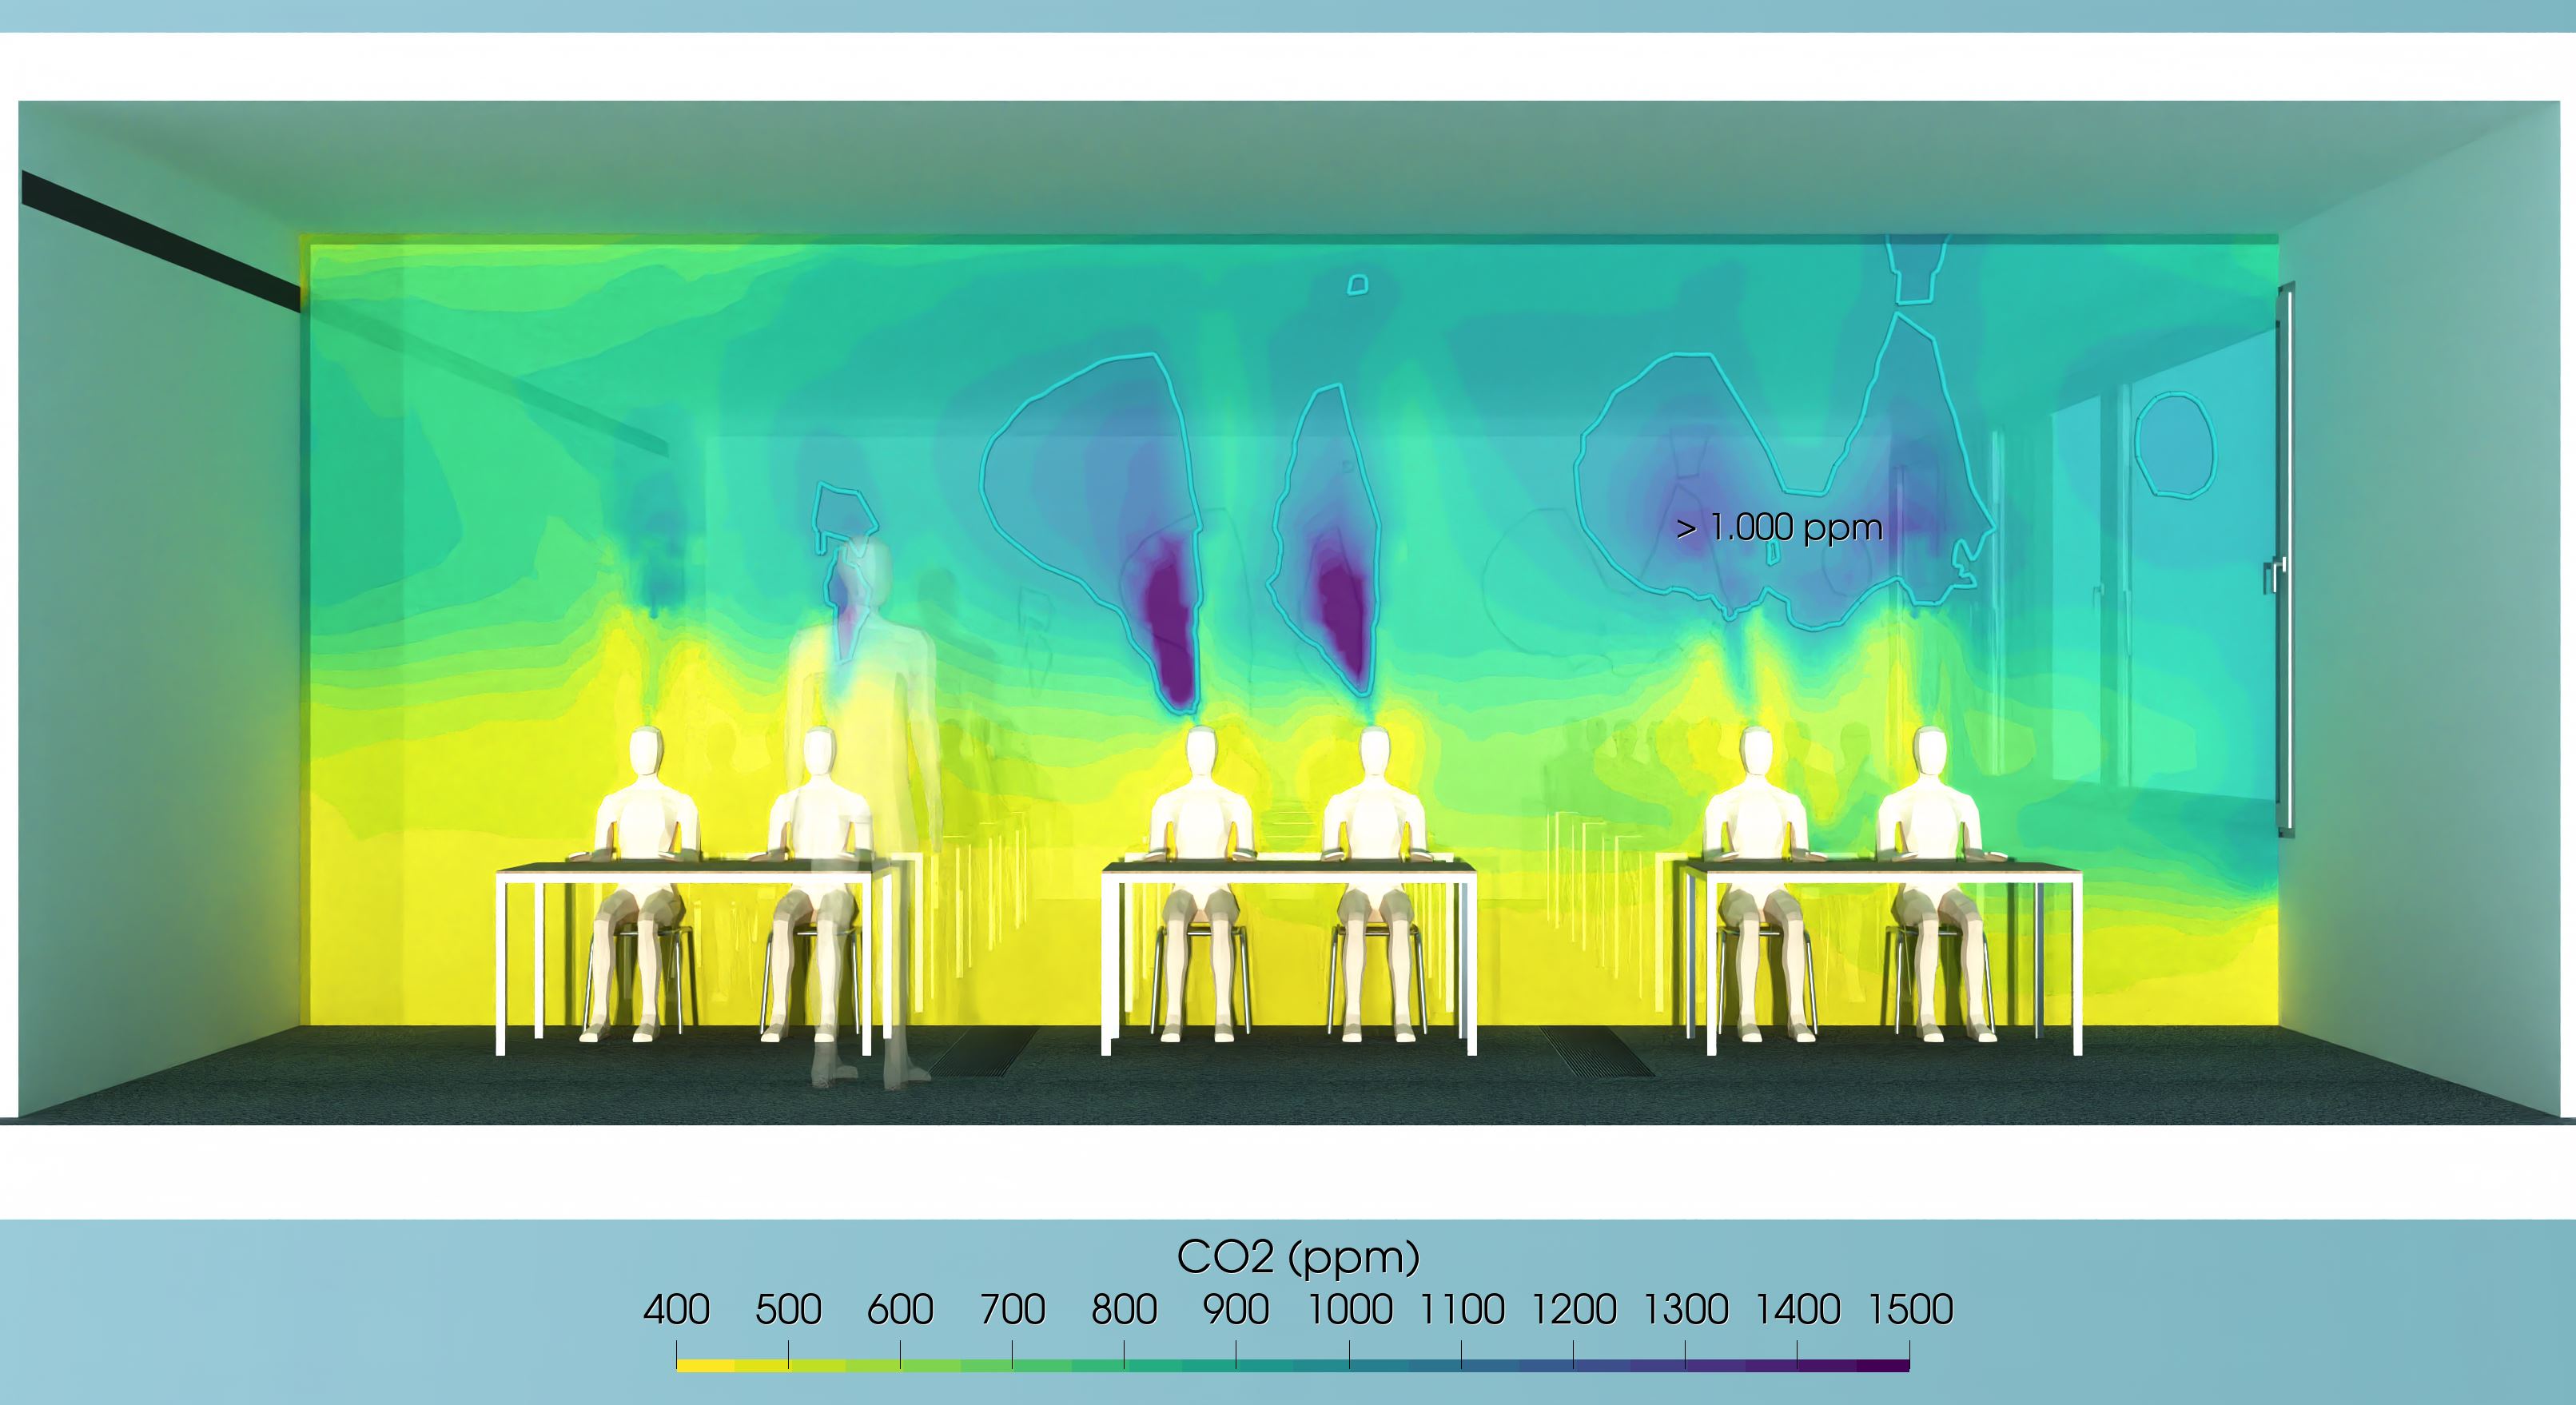

CO₂ concentration can rise quickly in densely occupied classrooms. A transient airflow simulation combines occupancy, window geometry, opening position and weather. It reveals how long a ventilation strategy remains effective and whether comfort, temperature and energy use are compatible.
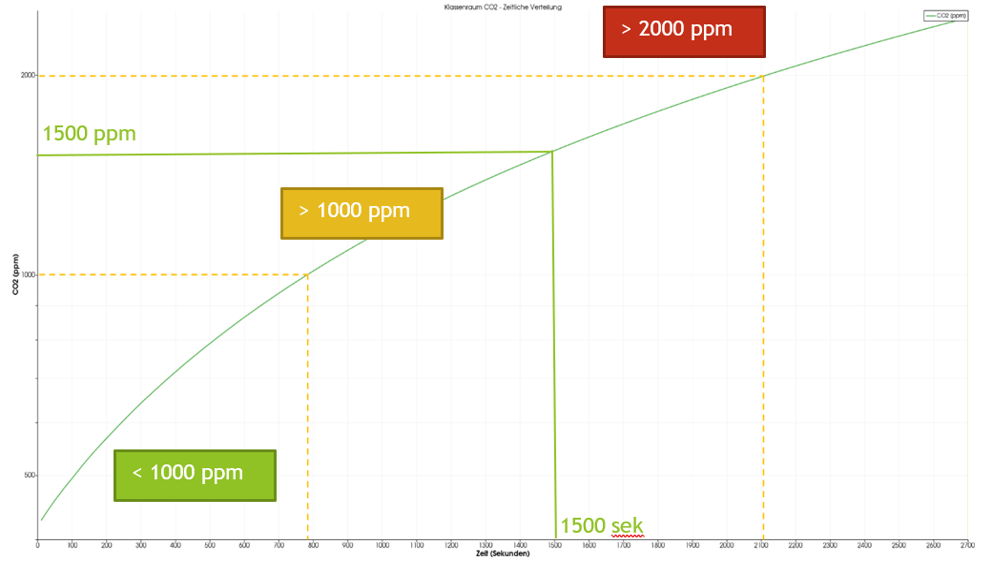
Occupancy and CO₂ generation by pupils are used to calculate the concentration throughout the lesson. The assessment identifies when defined CO₂ values are reached and how tilted windows or purge ventilation change the curve.
The times shown are illustrative. Reliable values follow from the room volume, pupil count, activity, window position and weather of the specific project.
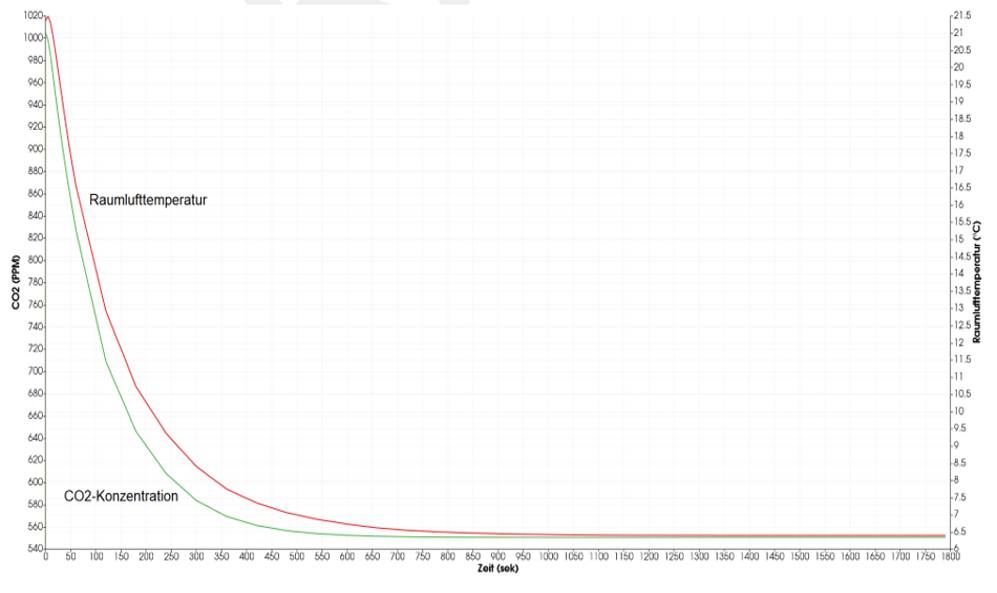
Fully opening the windows replaces stale room air very quickly. At the same time, the indoor air temperature responds to the cold outdoor air and can fall noticeably within a few minutes.
Indoor air quality, thermal comfort and heating energy are therefore assessed together. The goal is short effective ventilation without excessive cooling.
A room average does not describe indoor air quality completely. The simulation reveals the spatial distribution in the occupied zone, local concentration peaks above pupils and the removal over time after the windows are opened.
Every option uses the same room geometry, occupancy and outdoor conditions. This makes the real effect of each window position directly comparable.
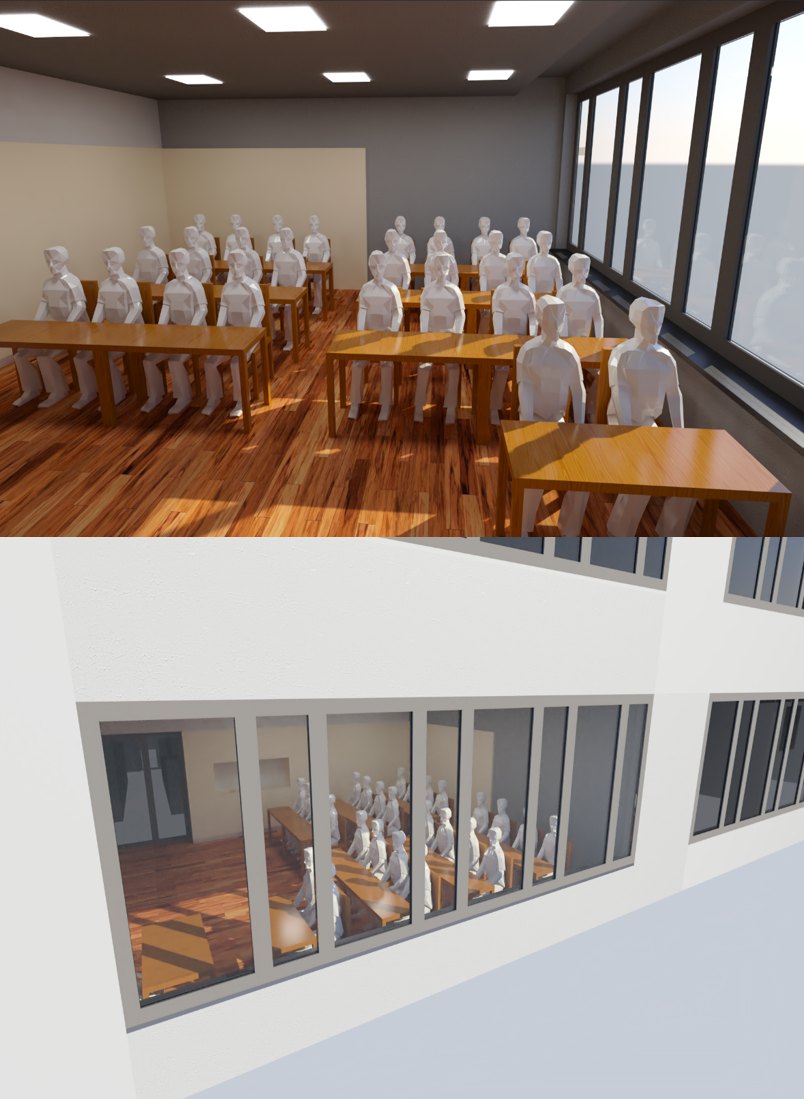
The reference case shows CO₂ accumulation from occupants. Outdoor air exchange is limited to joints and other leakage paths.
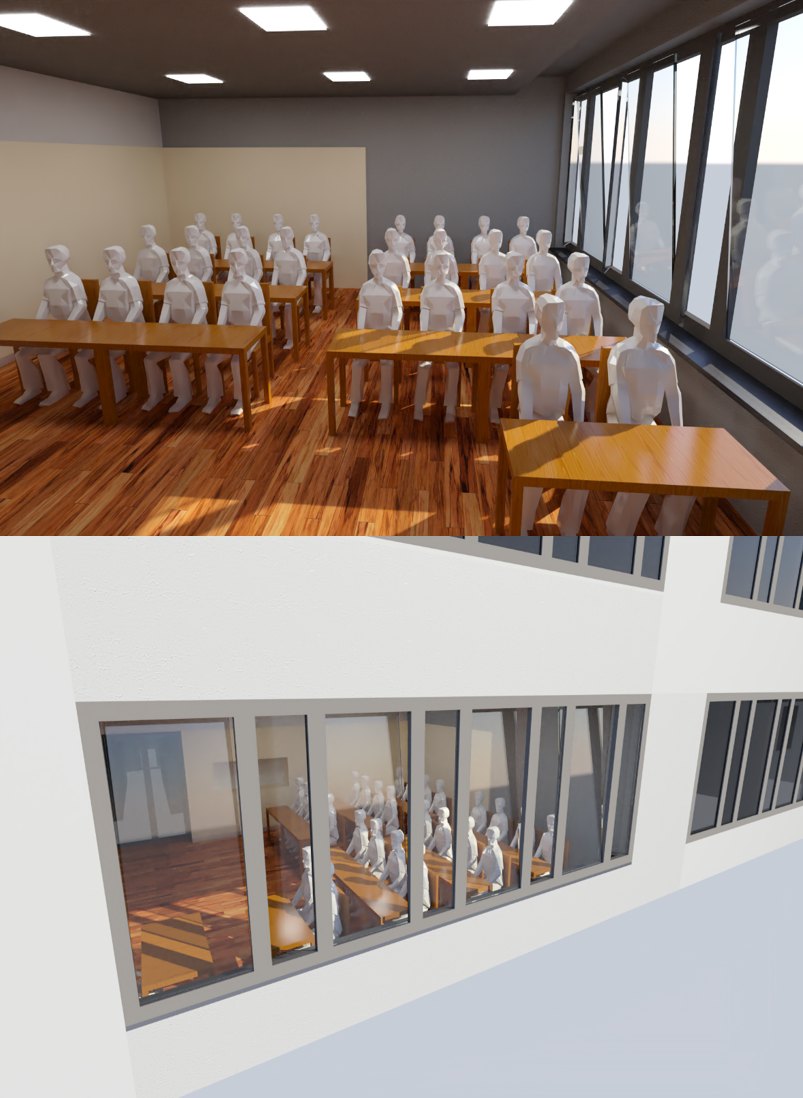
Tilted windows provide continuous but weather dependent air exchange. CO₂ removal, winter draught and heat loss are assessed.
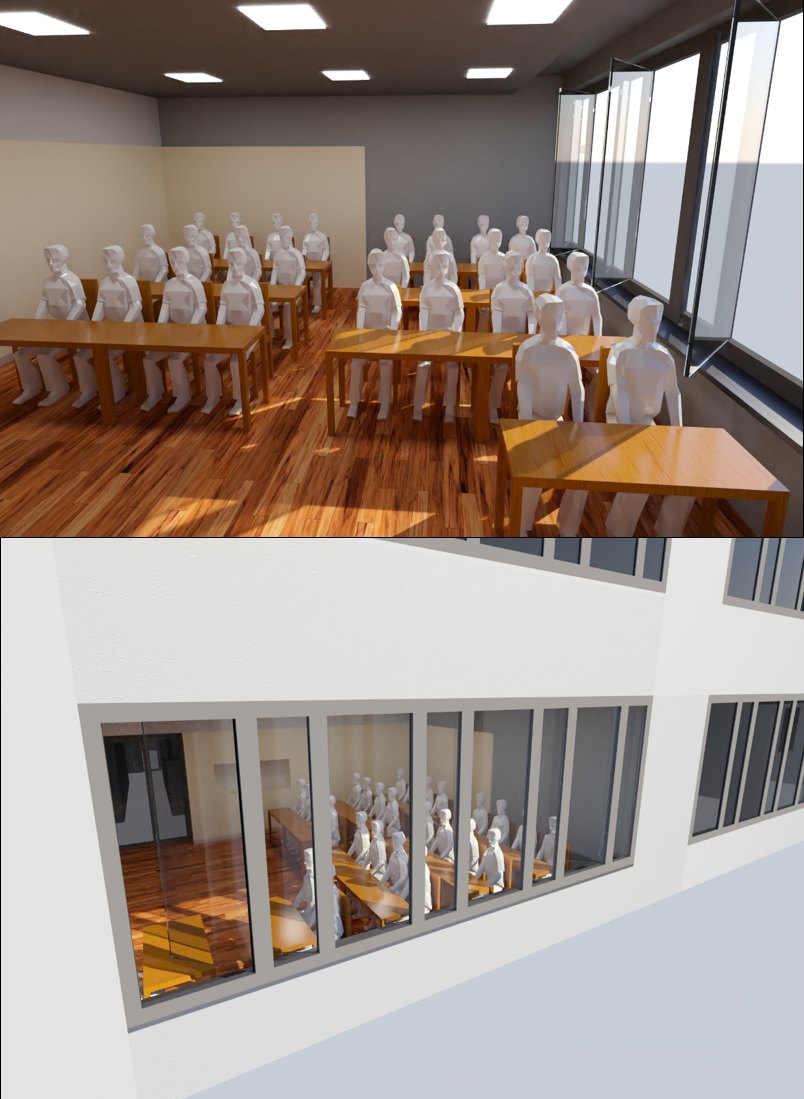
Fully open windows create a high short term air exchange. The reduction in CO₂, required opening time and thermal comfort are evaluated.
The room, windows and opening angles are modelled according to the design. CO₂ generation by occupants, lesson schedules, outdoor concentration, temperature and wind form the boundary conditions. Each window position is then simulated to determine airflow, air change, CO₂ concentration and room temperature over time.
Transfer room geometry, window areas and opening positions from the design
Define occupancy, schedules and CO₂ generation by people
Set weather, outdoor concentration and thermal boundary conditions
Simulate closed windows, tilted windows and purge ventilation over time
Compare CO₂ development, air change, temperature, draught and heat loss
A high theoretical flow rate is not sufficient on its own. Fresh outdoor air must reach the occupied zone and remove stale air effectively.
Temporal development and spatial distribution in the occupied classroom.
Actual airflow through the windows under the relevant weather conditions.
Local cooling and air velocity in the occupied zone.
Required frequency and duration of purge ventilation during lessons.
The assessment shows whether window ventilation is sufficient, which opening position is effective and when mechanical assistance is required. It provides clear guidance for design, automation and school operation.
Outdoor air may be distributed unevenly. Airflow simulation shows which occupied areas are actually ventilated.
Yes. Temperature difference, wind and opening duration are defined for each season and assessed separately.
Yes. Opening angle, duration and intervals can be derived for manual or automated ventilation strategies.
We assess occupancy, window design and relevant weather cases and develop a transparent ventilation strategy.