Simulate facade noise and make it audible
Facades can whistle, hum or generate tonal noise
Wind creates transient pressure fluctuations at louvres, perforated panels, joints, edges and cavities. Certain geometries amplify individual frequencies. Time resolved LES reveals where the sound originates, which frequencies dominate and how a design change affects the result.

Turbulent structures become measurable pressure signals
The LES simulation resolves large turbulent eddies over time. Alternating pressure fields form at facade edges and openings. Pressure histories at surfaces and receiver points are converted into sound pressure levels, spectra and dominant frequencies.
- Localisation of aeroacoustic sources
- Pressure histories at relevant points
- Frequency spectrum and tonal components
- Comparison of wind direction and wind speed
Identify periodic pressure fluctuations spatially
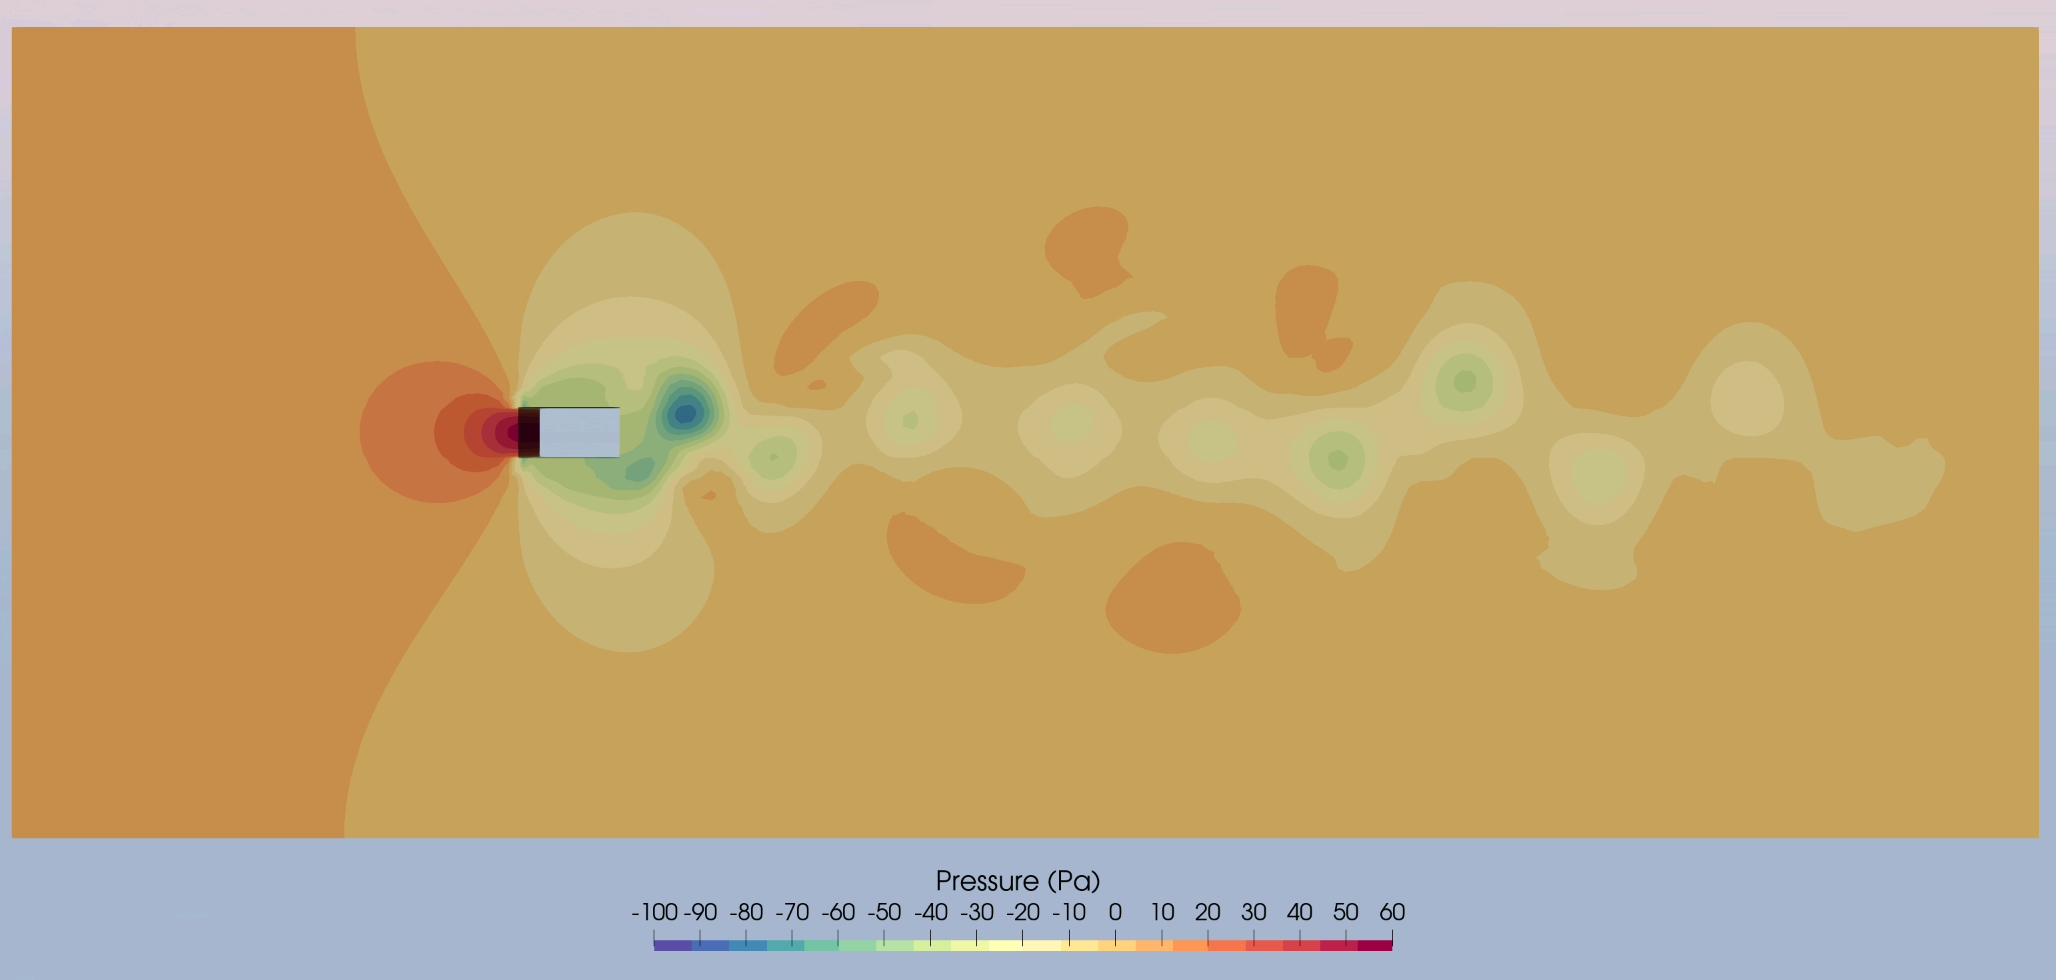
The snapshot shows the pressure field of the investigated oscillation at approximately 68 Hz. Alternating positive and negative pressure zones in the wake of the component reveal the excitation pattern. The time sequence is used to derive dominant frequencies and the audible signal.
From facade geometry to an audible frequency
The computational model reproduces sound generating details with their relevant edges, openings and cavities. Representative wind directions and speeds are calculated transiently. The resulting pressure signals are then evaluated in the time domain and frequency domain. Virtual microphones are placed at representative receiver positions in the flow field and record the pressure history over time. From this data, we determine sound pressure levels and dominant frequencies and generate a comparable listening sample as WAV or MP3.
- 01
Capture facade details and possible sound sources geometrically
- 02
Run transient LES calculations for relevant wind cases
- 03
Record pressure fluctuations on components and at receiver points
- 04
Determine frequencies by spectral analysis and map their sources
- 05
Prepare the calculated signal as WAV or MP3 for auralisation
Results that can be seen and heard
The assessment connects fluid mechanics and acoustics. It shows whether a noise is broadband or tonal, under which wind case it occurs and which design variant reduces its generation most effectively.
Simulation results become an audio file
A scaled listening sample can be created from the transient pressure signal. It makes differences between variants immediately understandable and adds an intuitive impression to charts, spectra and sound pressure levels.
Frequently asked questions
When is LES based acoustic simulation useful?
When wind noise occurs only at certain speeds or directions, when tonal noise is suspected or when small facade details may be the source.
Can the exact pitch be determined?
Yes. A frequency spectrum is calculated from the pressure history, making dominant frequencies and possible resonances visible.
Can the result really be heard?
Yes. The calculated pressure signal can be prepared as WAV or MP3 for comparative auralisation.
Can design variants be compared?
Yes. Modified edges, opening areas, louvre spacing or damping measures can be compared under identical wind conditions.
Check suspicious facade details acoustically at an early stage
We define the geometry, wind cases, frequency analysis and suitable design variants with you.